An account of the Jisc & HESA Library Data Labs Showcase and its future
Libraries are information and data centres like few others, both by the nature of their business and through the data they collect. However, with so much information, it is not easy to make effective use of the data they possess given their increasingly limited time and resources. Therefore it is timely that the Business Intelligence project, a joint initiative between Jisc and the Higher Education Statistics Agency (HESA), provided an experimentation opportunity to libraries to explore the potential of using the data and analytics tools available in the recently developed Heidi-Plus service.
What is the Library Data Labs project?
Library Data Labs is the third in a series of development cycles in the Business Intelligence project and followed the successful format of the two previous cohorts which involved working with university strategic planners. In addition to producing new business insights with the data available, the aim of those cohorts was to produce data-visualised dashboards which could be made available to others via the Heidi-Plus service.
This project differed in that it included library data with the aim of producing library-specific insights. Five cross-institutional teams from 23 different university libraries and one Jisc team worked for three months from mid-July to the beginning of October. Each team was led by a Product Owner and supported by a Jisc Scrum Master, who brought the teams together and guided them through the project using an Agile methodology. Teams were tasked with producing user stories to determine the questions that teams wanted the data visualisations to answer. Teams also committed to a scrum meeting one day per week across the 3 month project working iteratively and as a team to source the relevant data and produce their visualisations. Training in Tableau software was included with ongoing support provided throughout as well as specialist support for sourcing data provided by data experts from Cetis.
What did the project achieve?
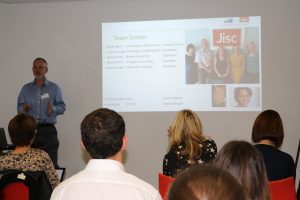
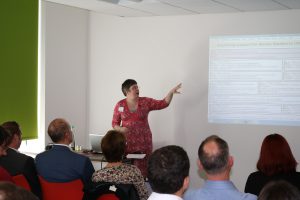
The project culminated with the showcase event in Manchester on 6th October. All six teams presented their dashboards to each other and our expert panel: Jonathan Waller, Director of Information and Analysis, HESA; Keith Cole, Executive Director of Digital Resources, Jisc; and Elizabeth Malone, Chair of the SCONUL Statistics Steering Group and Co-director of Library & Learning Services, Kingston University. It was particularly useful to have representation from SCONUL given the nature of the data being presented on the day. Each team addressed different library questions, resulting in a wide variety of dashboards being produced.
- Team Mary examined the impact of library space on student satisfaction across institutions and also the use of library facilities by different groups, including FTEs; alumni; mature students; distance learners; etc. and cross-institutional subject groups. They also produced a mapping of the Question 16 data from the NSS against each element of the SCONUL return data, perhaps providing greater insight as to the basis of the NSS score.
- Team Simon’s approach included demonstrating how dashboards could help support the Research Excellence Framework (REF) and Teaching Excellence Framework (TEF) aspirations, and understand trends and progress in open access publishing, looking green and gold OA. Another dashboard offered a ‘one-stop benchmarking shop’ enabling library directors to benchmark their library’s performance against other institutions, understand the impact of library metrics, including space issues, on student satisfaction, and identify important trends in the sector.
- Team Elizabeth explored data at a more local level using information about electronic resources usage at the department or school level and also by student type. This could offer many distinct insights from the suitability of a resource for a particular group to providing evidence for subscription negotiations.
- Team Frankie wanted to compare library spend on a given subject with comparator institutions and look at who was ‘excellent’ in a given subject using data available from NSS, REF and SCONUL data. With the administration of electronic resources budgets difficult to assign to subjects, this was not an easy task and the team issued a challenge to SCONUL and the library community to look at this and other data issues.
- Team Ian again had a more local based approach but none-the-less several distinct and impressive dashboards were produced. The first explored the need to analyse the value of e-journal subscription deals by looking at usage and cost and the likely effects of swapping titles in and out of a deal, and the cost effectiveness of the deal itself. Another dashboard involved mapping JACS to Dewey to understand student satisfaction and print resource provision.
- Team Jisc decided to take full advantage of the fact that it possessed usage data for all institutions using JUSP to look sector wide. For the first time, JUSP and IRUS-UK data were combined to give a truer picture of individual journal usage. Overlaying this usage data were a series of ‘quality’ measures such as Impact Factor and Altmetrics to examine the correlation, if any, between usage and ‘quality’. The financial implications of these deals was also presented and the potential for institutional profiling according to Jisc Bands and various mission groups was proffered as a potential add-on to the JUSP service in the future.
After each presentation, the panel members provided individual feedback and the audience voted on the viability of the dashboards for the future using a red, amber, green approach. Many of the dashboards received mostly green votes, indicating the desire to see the dashboards go into service via Heidi-Plus. Those dashboards that focussed more on local data understandably received more amber votes than green, but that was purely because as they exist at the moment, the Heidi-Plus service, being a national service is not the most suitable place. The Jisc team’s dashboards received entirely green votes but some further development work will be done to make these available to members.


A storify of participants’ tweets are available from the day.
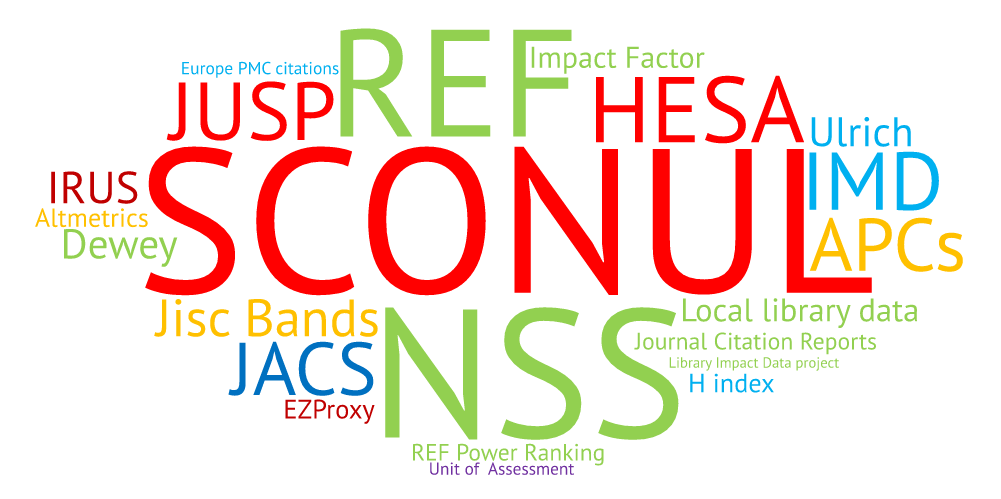
The data
The image below shows the data sources we used with the size indicating the frequency of use within teams’ dashboards.
What’s next for Library Data Labs?
Although the project is geared toward producing proof of concept dashboards only, the enthusiastic response among the showcase participants for what they saw and also the further development and enhancement of the dashboards described by the teams, demonstrated the appetite for such dashboards to continue into some form of service.
Despite the positive response, it is clear that the data available to the library community at present is not necessarily what is needed to begin to answer the questions that libraries need to answer now and into the future. This project has highlighted an opportunity for SCONUL and other data suppliers to examine their data to ensure it is relevant for the expanding evidence base required of and by libraries.
Jisc and HESA will shortlist the dashboards created by the library teams and determine which can go forward into the Heidi-Plus service. Jisc will also explore the continuation of Team Graham’s dashboards in helping to inform Jisc Collections’ negotiations in the future and providing a visualised institutional profiling offer via JUSP.
In 2017, it is planned that the process used in Heidi-Lab and Library Data Labs project is taken forward as a service offering so look out for a call for participants to join a new cycle of dashboard development.
If you want to keep up with the wider Business Intelligence project, or find out about upcoming dashboards, announcements will be posted on the Jiscmail list: JISC-HESA-BUSINESS-INTEL@JISCMAIL.AC.UK. If you want to get access to Heidi-Plus via your institution, then email heidi.plus@hesa.ac.uk.
