The 12th Performance Measurement in Libraries conference has just concluded in Oxford and provided Jisc its first opportunity to publicly present the outputs of the Library Data Labs project, which ran in the summer of 2016. This is a Jisc and HESA collaboration to deliver community developed interactive, visualised dashboards via HESA’s Heidi Plus service. The presentation included demonstrations of the outputs which will be available for HESA members to use from September 2017*.
The conference
Lee Baylis, technical lead on the project, presented alongside myself, Siobhán Burke, Programme Manager for Library Support Services as part of a very packed conference programme and to a balanced audience of UK and international attendees. As well as a brief overview of the project and history, we quickly launched into a live demonstration of the 4 dashboards going into service in September. These are:
- Benchmarking user satisfaction levels with library facilities. Using a number of parameters to build a set of comparable groups, this dashboard allows the user to better compare like with like and see the effects on the NSS scores.
- Space Analysis v footfall & satisfaction. This dashboard presents options for each of the SCONUL space measures plotted against NSS scores to highlight where there may be correlations.
- SCONUL Key Performance Indicators. Presenting key SCONUL measures as KPIs, allowing the user to benchmark their institution against their peers.
- Teaching Excellence Framework NSS Explorer. This dashboard brings together the NSS scores with key SCONUL measures overlaid to show the variance of that measure, e.g. spend varies with NSS score.
Reaction
The reaction from the audience was positive with a number of attendees coming to speak to both of us afterwards to find out more about all of our work in library data and analytics. Reaction was positive so much so that American colleagues in the room even asked if Jisc had an office in the States! One tweet from @LibPMC sums it up nicely:
Mind blown by @JISC library labs project in the Main Hall.
Future & further work
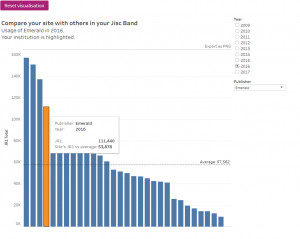
The presentation did not end there. The 4 dashboards going into service were not the only outputs from the Library Data Labs. Some of the development work has since found a more relevant place as part of Jisc’s Learning Analytics project as this project moves into a phase focusing on library data. In addition, the Jisc team who took part in Library Data Labs, have also taken forward their work from this project to the point where the JUSP service have developed new functionality for the service. In autumn 2017, a range of dashboards will be available to JUSP users based on a number of reports. The image below gives a flavour of what will be available.
And finally, there has also been a subsequent Library Labs team recently finished in July this year. That team have developed new dashboards including one showing NSS scores for all HE institutions versus key SCONUL metrics on expenditure over time. These will also go into service in September this year.
The full conference proceedings, including a more detailed paper on this presentation, will be available later in 2017 or early 2018.
If you want to keep up to date with developments in this space, then sign up to our mailing list: http://www.jiscmail.ac.uk/JISC-HESA-BUSINESS-INTEL
* Subject to HEFCE and SCONUL approval for use of their data
